Governing Cx through Line-of-Sight

line of sight gearsAn end-to-end approach for managing customer experience strategy and delivering on its promises...

Over the past 24 months, Customer Experience Initiatives (Cx programs, as they have come to be called) have climbed to the top of the radar screens of most leadership teams. Organizations are abuzz with projects to identify “touchpoints,” map “customer journeys,” and strengthen their customer-facing business processes. Alongside these initiatives are even larger investments in acquiring the data and analytics required to feed and sustain these service improvement strategies. >>Next>>

Read Full Article

Metrics that make you go…YAWN…

Inspiring or Uninspiring?                                                                                                       -It all starts with the strategy…

On each client engagement, regardless of type (Business Planning, Assessments, Turnarounds, Process Improvement, etc.), we invariably find ourselves working extensively with what I call the company’s or business unit’s Strategic Performance Framework (i.e., the specific goals, objectives, and KPIs of the area in focus). That is because these three critical elements serve as the foundation for everything that follows. It essentially answers the proverbial  question “For the sake of what? (FSOW?). FSOW are we making this or that investment? FSOW are we developing a new product? FSOW are we consuming resources to improve a specific business process?  FSOW are we changing our organization chart (again…)?

Without a thorough analysis and understanding of  goals, objectives, and KPIs, any plan that is developed will simply be a formalized road map for throwing darts at a wall. Goals and objectives tell us the destination. KPIs give us continuous feedback as to whether or not we’re on course for our journey, or if deviations from plan are occurring.

This shouldn’t be new to many of us, as any manager worth his salt understands the basics of strategic thinking and performance management. Yet, when we step back and look at the organization or business unit in total, it’s not unusual to observe some big “cracks” in the foundation. And often it is often the KPI’s and metrics that are the first indication that the strategic underpinnings of the business unit are starting to get shaky.

Strategies vary…and so should KPIs…

Working with as many organizations as I do, you would naturally expect the destinations of each client to be different. Take “customer contact” organizations, for example, where there are clearly a myriad of contributions that the organization can be set up to achieve — providing purely reactive service, converting leads, driving participation in customer programs, increasing market share, retaining customers, building loyalty… the list goes on. And most often, these goals and objectives do, in fact, differ from company to company (although there is a growing tendency among managers to “follow the pack” where  goals and objectives are becoming more about “maintaining the course” than about providing new and inspiring destinations — a subject for another day!)

But despite the wide array of strategies we expect, and often see, we still find that nearly every customer service organization focuses on the same operating metrics. Back to the Call Center for a moment, here’s a list I can almost guarantee that EVERY company focuses on.

  • Speed of Answer/Service Level
  • Abandon Rate
  • Call Queue Length
  • Average Handle Time
  • Agent Satisfaction
  • Agent Availability/Productivity

 The list goes on…

No matter how different the objectives are for the Customer Service channels, the measurements (the things the reps care most about since they influence everything from raises to career progression) remain the same. Don’t believe it? Next time you see your call center manager at the coffee machine, ask them what the top three measures of success are for their group. Try the same question with the reps themselves.

How can that be? Dramatically different destinations, yet metrics that tell you little about progress toward the destination, assuming your mission is something other than churning calls, tasks, and shifts.

Are you “de-motivating” your workforce?

This is clearly a sad state of affairs, because it not only tells us how disconnected our day-to-day activities are from our strategy (read PURPOSE), but really exemplifies how intellectually lazy our strategic planning processes have become. Assuming the organization has developed a compelling and inspiring purpose (which many have, but most still lack), very few have a set of KPIs that track with it. Worse yet, most of these KPIs (the ones above that have been measured for decades) scream for more clarity, consistency, and targets based on something other than “finger in the wind” aspirations or the “annual 5% improvement.”

And as these KPIs trickle down into the organization, their relevancy begins to wane exponentially. What can a call center manager or rep do from one day to the next to drive an outcome like average service level? Sure, there are long term strategies to “course correct” when negative trends emerge (better forecasting of workload, more flexible staffing strategies, etc.), but what about day-to-day behavior? Most often, this is left to the intuitive feel of the operating manager and their motivational style, which can affect consistency and effectiveness over time. Even if you end up measuring things that are “conventional” or somewhat dated, failing to link these in some coherent and causal manner to the organization’s broader goals will undoubtedly elicit the proverbial yawn…that is assuming they haven’t already dismissed the metrics as irrelevant.

Waking up your strategies and KPIs…

So here are my five tips for “waking up” your customer metrics:

  • Make sure they are built on the foundation of a compelling and clearly articulated strategy. If your strategy doesn’t get you out of bed energized every morning, you’ve got more work to do. Resist the temptation for that “follow the pack” 3-5% improvement gain from last year. What is it your business unit is really there to accomplish? Think business outcomes (sales, leads, changes in customer disposition, etc…) rather than operational activities (calls answered, transaction speed, etc…)
  • Line up your tactical objectives to your strategic purpose. If your goal is, say, to improve customer loyalty, then your objectives should revolve around the known drivers of loyalty. And avoid the “circular answer” to these questions. An objective for attaining loyalty is NOT to improve transaction satisfaction, but more likely, to eliminate the need for the transaction in the first place.
  • Develop relevant, clearly understood, customer-centric KPIs. Should you really be measuring, “average service level”, or should you be measuring the number of times a call exceeds 20 minutes, or the number/percent of calls that get dropped prior to resolution, etc. I’d submit these are bigger drivers of loyalty and dissatisfaction than, say, average queue lengths or duration of after-call work. Think one or two levels beyond what you’re currently measuring. Think drivers versus macro results. If you’re on a journey from New York to California, a measure like service level is akin to telling you what state you’re in when it would be more helpful to know when you go off course by x%.
  • Make metrics relevant at the department level AND the work face — the best metrics are those that can be discussed and improved at any level in the organization. If your objective is to eliminate a particular source of dissatisfaction, then declare what that driver is and measure it at every level across the business. Get the organization talking in the same language and counting things the same way, and you’ll be tracking a lot closer to your desired outcome.

Having a set of metrics for the sake of measuring things is not only a waste of time, but can be a real distraction to achieving your desired outcomes as a business. If your mission, goals and objectives have been declared in a clear and compelling manner, then do yourself a favor and spend some time making sure your metrics will guide you toward that outcome.

-b

Author: Bob Champagne is Managing Partner of onVector Consulting Group, a privately held international management consulting organization specializing in the design and deployment of Performance Management tools, systems, and solutions. Bob has over 25 years of Performance Management experience and has consulted with hundreds of companies across numerous industries and geographies. Bob can be contacted at bob.champagne@onvectorconsulting.com

Does Size Really Matter?

A Little “Customer Voyeurism”…

Last week, my family and I took a vacation to visit some of my in-laws in California. For those of you who know me, you’ll appreciate the fact that any trip for me is an opportunity for a little “customer voyeurism.” That is, I very much enjoy watching exchanges between customers and service providers, whether I am engaged in the transaction or not, largely because they provide me with a wealth of perspectives that serve to validate and augment the many years of performance data, benchmarks and trends I’ve collected in my research and client engagements. So, while spending part of my vacation documenting the customer experiences of myself and others may seem a little weird to some of you, I was not about to miss the insights that would undoubtedly be generated by this seven-day excursion into the depths of airline, restaurant, amusement park, golf course, and taxicab servicing processes.

Like most, this trip did not disappoint (as far as the volume of insights and “take-aways” go). While there was no shortage of examples on both the good and bad aspects of the customer experience (too many to share in one post), I decided to zero-in on what I am finding to be an interesting phenomenon, i.e., the apparent implication of company size on customer satisfaction, engagement, and perception.

Here’s what the data from my little informal research gig told me:

  • The vast majority of transactions (experiences) appeared to be “issue neutral”- apparently meeting expectations of the customer (deduced through a lack of a visible change in emotion on either side)…Note that I use the word expectations deliberately since I believe many customer’s expectations are considerably lower than in past years. Hence, delivering against a “bar” that is set very low is not likely to produce a lot of emotion other than resignation or apathy.
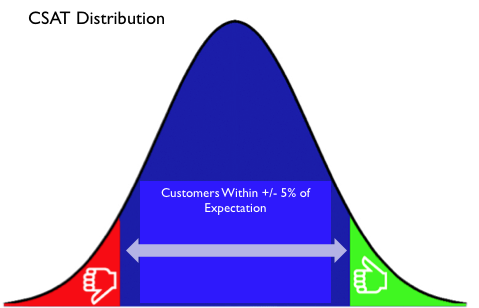
  • While they were few and far between, there were failures and successes on “the fringes” of the distribution. I’ve shown a simple example of what I mean, although I believe actual research on a broader set of experiences would probably show that the distribution is anything but “normal” /gaussian (i.e. these days it is likely skewed to the left assuming customers still have some semblance of  expectation (hope) of good service, which of course, is debatable  (I’ll leave that for another post).

That notwithstanding, If we were plotting this data, we’d be talking about a data distribution with some range of values that characterize the majority of observations, and a small number of significant negative (small in number, but “intense” as far as generating negative emotion…and what our lean or six sigma brethren would call “failures”), and significant positive experiences (pure, but perhaps unexpected, delight- or what my friend Stan Phelp’s at “9 Inch Marketing” (no relationship to the title of this post!!!) likes to call “Lagniappe” in his “purple goldfish” project), at the “tails” of the distribution.

In my experience on this trip, the above distribution was more in line with my observations in that there were probably an equal number of positive and negative experiences on each side of the norm, along with a similar proportion of significant negative and positive experiences on the fringes. The following however, was particularly noteworthy.Most

    • (90%+) of the really poor exchanges (generating a fairly clear display of emotion from neutral, to visibly “pissed”) occurred with what I would call larger more established companies
    • Most (60%+) of the really positive exchanges (generating what we might refer to as “delight”, or as Stan Phelps likes to refer to it, “customer lagniappe”) occurred with small companies (“Mom and Pops” and/ or specialty stores in cottage industries)

I’ll say again, that throughout this trip, I was only able to observe several dozen transactions between a variety of customers and service providers, including those encountered by yours truly. And while this hardly qualifies as a statistically relevant sample, and falls well shy of what I would consider a rigorous research approach, it served its purpose of identifying a subject worthy of some debate and dialogue.

Why Size Matters…

Why does the above phenomenon occur? Hard to say exactly, but my hunch would be that it has a lot to do with the history and evolution of these organizations. Clearly the smaller “niche players” have a vital need to differentiate and compete, since many lack the market size and scale to do so “naturally.” And while service is one way to accomplish that differentiation,  you’d expect some real “over-achievement” in this segment. In fact, the brand identity of many of these companies is directly tied to some “exceptional” aspect of their product or service offering (e.g. the special touch in the packaging, the handwritten thank-you note, or similar gestures). It’s a necessity for these companies, and when they realize they’ve stumbled onto a differentiator (deliberately or by accident), it’s relatively easy to clone and replicate.

No so much with the larger players. Sadly, many of the companies causing the above “grief” were once viewed as nimble and leaders in CS space (think  wireless providers, regional airlines, etc.). Not anymore. Sure, they all have their positive exceptions, but with these companies, many of the interactions have been routinized into their operational processes and automated systems, most of which were built on the foundation of operational and technology excellence, rather than on the basis of what differentiated their service to begin with. That leaves the only opportunity for real customer “delight” in the hands of standout employees operating “on the margin”, often operating  outside of the process to either strengthen the exchange or recover from a process-inflicted problem. While scale and size should be an advantage, many of these companies have allowed it to become a disadvantage.

That is not to say that the larger companies did not generate some level of delight, and that the smaller companies didn’t generate some significant failures. For example, I did get a “call back” from a CSR after a “disconnect”  from a rather large company call center,  which was nice to see for a change. I also experienced what I’d call a “super save” from an airport employee to avert what could have been a significant failure. And the small companies, on occasion did generate some negative experiences. Interestingly though, my tendency was to “forget” these failures quicker, giving them the benefit of the doubt for not having all of the CRM tools and technologies that larger companies have at their disposal. But in the end, my observations were my observations, and the trends were notable.

Breaking the Trend…

Given the above reality that size does apparently influence customer experience, and recognizing that “shrinking the company” is not the desired path to breaking that trend, companies that are increasing in size and growth need to be especially vigilant in five key areas:

  • How we measure success – We need to once and for all get beyond the measurement of general perception, because it tells us little about performance against real customer desires, and tells us virtually nothing about what is really happening on the margin.
  • How we view risk and failure – When we think of risk and failure, we normally think of manufacturing or operational processes, not customer processes. We need to get beyond the notion that 95% satisfaction is acceptable, and into the zone of limiting the number and magnitude of breakdowns on the margin (what are now viewed as exceptions or acceptable tolerance. Think: How would a Six Sigma or Lean driven manufacturing process view this challenge?
  • How we build our processes – We can start by changing from a functional to a market-driven approach to building our processes and systems. Most systems today are built to optimize cost and effectiveness at the transaction level, rather than the customer level.
  • How we staff and develop our employees – It is becoming harder and harder to find retainable employees that come “hardwired” with a strong CEM mindset. Finding and retaining them in large numbers is virtually impossible these days given employee demographics and market conditions. We need to look to other industries and functions to learn how to build and clone the human capital skills to support and enable the above processes.
  • How we manage and reinforce performance – In support of all of the above, we need to change what we teach, how we lead, what we observe, how we motivate, and what we elect to reward in terms of its orientation toward CEM excellence.

The old adage…think globally, act locally…seems to have some relevance here. I am firmly of the belief that the notion of large size, scale and growth can effectively co-exist with high levels of service, at the norm and the margin. It just takes work on the front end to design the right foundation to make it all work.

-b

Author: Bob Champagne is Managing Partner of onVector Consulting Group, a privately held international management consulting organization specializing in the design and deployment of Performance Management tools, systems, and solutions. Bob has over 25 years of Performance Management experience and has consulted with hundreds of companies across numerous industries and geographies. Bob can be contacted at bob.champagne@onvectorconsulting.com

SM Metrics- Getting beyond followers, klout, and social butterflies!

More Metrics Insights- Really? Haven’t we had enough?

I’ve been following all the “buzz” over the past week from #SXSW and now #eMetrics regarding the development, reporting and use of “metrics” in Social Media (SM) space. Quite interesting dialogue to say the least.

For some of you, particularly those who don’t live and breath Social Media, all of this may have turned into “white noise”, as this weekend appears to have exhausted just about every angle on the subject of SM metrics that we could possibly explore. But  fear not! As another week kicks into gear, there will no doubt emerge a new wave of posts and blogs on the very same topic.

But I must admit, that all of this “metrics talk” does strike a chord with me. After all, having spent nearly two decades in helping company leaders and managers get their arms around business metrics, and the broader discipline of performance management, you would expect my ears to jump up at the word “metrics”! (I know…sad but true). And while SM is not an area I have spent an enormous amount of time studying or participating in from “the inside”, I am finding that many of the same principles I use with my “corporate clients” and  very much “in play” for this new and ever evolving market.

Stepping outside my “sandbox” …

While my life does not revolve around advances in SM, I have become what one might call a “steady  user” of it. From my evening “blogging” hour, to ongoing “check-ins” via Twitter, Facebook and LinkedIn; I would confess to spending at least 10-15% of my ‘awake time’ interacting with online friends and colleagues.

Of course, like many of you, Social Media (which for me includes my morning time with my Pulse reader scanning news and blogs that I monitor) has replaced the time I spend reading newspapers, magazines and “industry rags” (in fact it’s become much a more efficient medium saving me lots of time and energy). And those ongoing “check ins” that I initiate, usually occur when I am either ” restricted” (cabs, airports, etc.), between tasks, or otherwise indisposed (I won’t elaborate on the latter- you get the idea).But the “blogging hour”… that is something separate for me, and while I do enjoy it and it helps me unwind, I also recognize it for what it is- a personal and professional investment in my own development.  So yes, you could say that SM should be important simply because of the 15% percent of my day that I rely on it for.

But for me, it goes a little beyond that, especially now that the conversation has turned to metrics, and the broader issue of managing SM performance and results. Ever since I got into the Performance Management discipline years ago, I’ve been a strong believer and proponent of finding ideas and insights, wherever they occur (different companies, different industries, different geographies, etc.), and applying insights to current challenges within our own environments. Some would call this “benchmarking”. Others may call it good learning practices. For me, it’s not only common business sense, but a core set of principles that I live and manage by. And for many like me, it is the basis of any good Performance Management system.

So it’s only natural for me to observe what’s going on in this space and try to open some good “cross dialogue” on how we can lift the overall cause that I know we all are pursuing: More effective measurement, better management of performance, and stronger results.

Exploring “Best Practices” In SM Performance Measurement…

A few weeks back I published a post on what businesses outside of SM space could learn from what is happening within SM. Many of you found that useful, although I must admit that it was the first time that I really began experimenting with what was available out there in terms of thinking andtools. But rather than focusing on the tools, I tried to explore some of the bigger themes that were emerging in terms of practices and approaches, and attempted to determine which aspects of that thinking in SM might be be “import-able” by other sectors as “lessons learned”.

Today, I want to ‘flip the tables’ a bit, and talk about what other industries can teach Social Media about the art of measuring, improving, and delivering on our individual goals and aspirations.

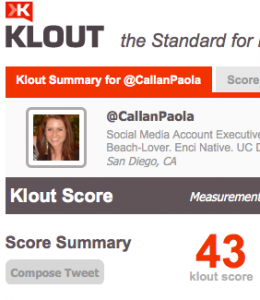
I was inspired to go this direction by a number of posts over the weekend that appeared to delve into the same question (here’s an example regarding the measurement issues with Klout) When I read that, it sounded like some good stuff, I realized that this was really  the tip of the iceberg on a really important issue. So expanding on this seemed to be the next logical step.

So what Can SM Learn From Others?

The below observations are based on merely a snapshot of what I see taking place now, and fully realize that dialogue is occurring at this very minute in certain hotel bars and restaurants on this very topic. My goal is not to suggest an exhaustive list of “fix it now’s”, but rather to open an ongoing dialogue on what we can learn and apply in our individual areas of expertise.
  • Is what we’re measuring today meaningful?

OK, let’s get some basics out of the way, at the risk of boring (or offending) some of the social media pundits and ‘real experts’ out there. For most users (consumers of Social Media)- the everyday user of Facebook, LinkedIn, and Twitter, for example- the answer to ‘whether or not SM measures are meaningful ?’ is “probably not”. Save for ego and vanity, measurement of things like the number of “digital friends” (Facebook friend counts and Twitter followers for example) mean very little to the nature of managing meaningful relationships- whether it is in maintaining existing ones, or growing new ones. Meaningful relationships go way beyond these surface level statistics.

Of course, there are those individuals and businesses who do use, and rely heavily on, more in depth statistics for tracking their progress. So I believe at least some of them would say “yes- meaningful…but with a lot left to be desired”. The stats and measures are there. Are they meaningful and value adding to the business? Subject to debate.

What we can be certain of, is that things like Follower counts, Klout scores, Retweets, and Click-through’s are measures that are becoming less and less valuable, and that there is a deep yearning for more. Whether this takes the form of refining what’s in the algorithms and “black boxes” , or a major rethinking of the metrics themselves (which would be my vote), still appears to be a subject of great debate.

  • For the sake of what?

When you walk into a large company that “manages by the numbers” (and trust me, many don’t), you see that there are literally hundreds, if not thousands of things they are tracking. Some are real meaningful, and some are as useless as an “asshole on your elbow” (I heard that one from a old (and wise) plant manager in Texas, and have been waiting months to use it- hope I didn’t offend :)

When I see that level of measurement/ quantity of metrics, a little “warning sound” goes off in my head and I start exploring the question: “For the sake of what?” are you measuring this or that? I use a variety of techniques to get them to tell me how they are going to use a certain metric (most often the question of “why?” asked repetitively works best), but often the question is rhetorical because there is no answer. I once heard someone say, “If you want to see if information is valuable, just stop sending out the report and see if anyone screams!”.

Fact is, if a measure doesn’t have a causal link to some major result area, or worse, if the person managing it cannot see that link, the metric serves no purpose other than to consume cost. Most of the tools I see in SM space for tracking metrics simply  report stats with no obvious linkage to any real outcome. Even if something like # followers was important (and we all know that most often it ranks pretty low), there is no clear path evident in the reports on how the stats actually impact an outcome that is important to the user (other than loose descriptions and definitions at best).

Yet, we all know that the tools and models for establishing those linkages exist everywhere. Just look at some of the basic tools used by stock traders. While they are not perfect by a long shot, “technicals” like Stochastics, Bollinger Bands, and simple breakout patterns, have clear paths to a high probability event or outcome, yet are available to even the most amateur  investor. Even “stogy” old Utility companies can draw connections between things like permit rates, new connection activity and downstream staffing requirements. I’m not suggesting it’s easy, just that it’s important and that the tools are there to execute and simplify.

  • Who really cares?

For me, this is the MOST IMPORTANT item on the list. Most of us have seen the Klout site, Twitalyzer, and the myriad of other tools out there to support the development of personal networks. These tools are extremely useful, and possess a wealth of information if you have the time and stamina to think about what it all means. I mean, come on… to have 25 metrics on one page with trends only one click away is something that a real metrics guy can only look at and say “WAY COOL”. Seriously, very cool! That’s the good news.
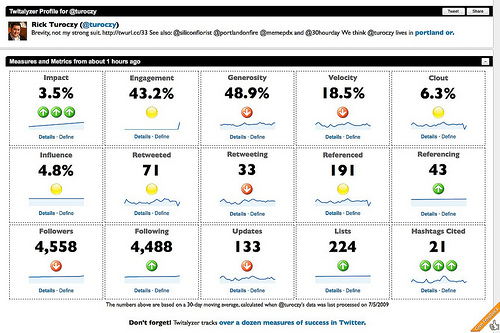
The bad news is that it’s the same news for everyone. But we all know the dangers of “one size fits all”. I’m not diminishing the value these tools provide. SM would be lost without them. And in their defense, certain sites like Twitalyzer and Klout have gone beyond the simple dashboards and have incorporated categories that many aspire to, and have begun to draw some connection between these aspirations and those broad categories.

But it’s just a start (I mean come on…Are  any Twitter users actually aspiring to be “social butterflies”? (ok, don’t answer that, because they’re probably some who do!) Perhaps a better question is whether a “social butterfly ” would ever aspire to be a “thought leader” ? My point is that it’s probably not a linear sequence of development, and while these categories get us one step closer to aligning measures with goals, they are still missing 2 things:

1) Better understanding of the goals of users (its probably more than 4 and less than 100) and

2) a guidance system that helps one use the metrics to achieve those goals.

So here’s a thought…What about a simple interface that allows you to pick a goal, and then tells you which metrics you should care about and what the target should be to accelerate within that goal class? You’d be building a model that would clearly feed on itself. I’d be surprised if the BI guru’s out there don’t already have this built into their corporate BI suites and Web Analytics tools, but it would seem to me to be a great draw for the myriad of other users with goals that extend beyond butterflies and mindless follower counts.

Find out what’s important, at as customized a level as you can (and is practical), and tell us how to get there. That’s the “holy grail” in every business, and what every CEO is and Executive is craving from its performance management process – “I’ll tell you what my strategic goal/ ambition is,…and you tell me what the metrics AND targets are  that will help me get there,… and then help me  track my progress!”

  • Can tools help? (and how?)

Absolutely and without question, the answer is yes. But just as other businesses and industries have jumped too quickly, often placing ‘technology before process’, so has SM in my view. Part of this is because of how the industry is “wired”, and how it has evolved. Born through technology, and managed and staffed with a heavy technology bent, it’s not surprising that we’ve reached a point where the data has become king, UI’s have a lot to be desired.

I’m not talking about the ease of navigation, the placement of charts, or the rendering of drill down information. I’m talking about how the user (the customer) thinks…starting with their goals, and accessing the relevant metrics to show progress and critical actions they need to take to improve. I suspect the developer who can “visualize” (to use an overused term in today’s SM environment) that kind of “line of sight” will ultimately win the hearts of its users.

The other role technology can play is enabling the algorithms and models that are required to deploy the kind of “mass customized”/ goals oriented solution I described above. Without these tools, the likelihood of being able to normalize, analyze and model these relationships would be impossible. So in my view, the tools are critical, but the effort first needs to be on the process (getting the line of sight understood) and then working the raw data in a way that renders it in a context-specific visualization. That’s in a perfect world- but it’s still a good aspiration.

Like I said, these are just the things that are ‘top of mind’ for me at the moment, and only informed by the lens through which “Bob” is looking. I’m sure some of these issues are top of mind for you too, and you may actually be unveiling (right now) that new “holy grail” subscription site  that has the answers. If so, great…I may be your perfect customer. But if the last two decades have taught me anything, it is that different perspectives and different lenses often pose new questions and spark new crystal balling that lifts the entire game.

Of course I welcome any comments and expansion on the above list. As I said earlier, this is just the beginning of my own thinking, inspired in part by some of yours. I look forward to more of yours!

PS- For anyone who is interested in Performance Management and Metrics topics outside of the world of SM, feel free to bookmark http://EPMEdge.com

Links to some of my more recent posts on these subjects are provided below

Incorporating the principle of “line of sight” into your performance measurement and management program

Managing through the “rear view mirror”- a dangerous path for any business

Data, information and metrics: Are we better off than we were 4 years ago?

-b

Author: Bob Champagne is Managing Partner of onVector Consulting Group, a privately held international management consulting organization specializing in the design and deployment of Performance Management tools, systems, and solutions. Bob has over 25 years of Performance Management experience and has consulted with hundreds of companies across numerous industries and geographies. Bob can be contacted at bob.champagne@onvectorconsulting.com

Data, Metrics, and Information- Are we better off than we were 4 years ago?

Data, data…all around us…

Most of the projects I work on day in and day out involve data to varying degrees. I use data quite extensively in all of the assessments I do on organizational and operational performance. I use it heavily whenever I benchmark a company’s processes versus a comparable peer group. Data is at the very core of any target setting process. And, of course, data is (or at least should be) the beginning, and a continuous part of any gap analysis and any subsequent improvements that follows.

Today, the hunger that organizations have for good data has reached such unprecedented levels, that whole industries have developed in and around the domain of  what we now call “Business Intelligence” or BI. Having consulted to organizations over the last three decades, I’ve seen this hunger level increase steadily throughout the entire period. But no more so than in the past few years.

However, despite all the gyrations that we’ve gone through over the years, one of the first things I hear from C-Suite Executives is that they still feel  “Data rich and information poor”. So I’ll start this post off in the words of late President Ronald Regan by asking, “Are we better off or worse off than we were 4 years ago (in terms of translating data into useful and actionable information)?”

So are we better off than we were 4 years ago?

As any good politician, I would have to hedge a bit, and say yes, and no. And appropriately so I think.

We are most certainly better in our ability to “access” the data. If you’ve lived through the same decades as I have , you will remember the painstaking efforts we all made to extract data out of those proverbial “source systems” (when “SAS routines” had nothing to do with the SaaS of today). Everything from the data inside of our source systems, to the tools we use to access the data, to the ways in which we report and visualize the results has moved forward at lightening speed. And so, from that standpoint, we are, in fact, better off.

But on the other side of the coin, our tools have, in most cases, outpaced the abilities of our organizations and their leadership to truly leverage them. At a basic level, and in part because of the technology itself, we often have more data than we know what to do with (the proverbial “data overload”). Some would say that this is just a byproduct of  how wide the “data pipe” has become. And at some level, that’s hard to argue.

But I think the answer goes well beyond that.

“Data rich, information poor”…still?

In large measure, yes. The bigger issue in my view is the degree to which the organization’s skills and cultural abilities enable (or better said, disable) them to effectively utilize data in the right ways. Most companies have put such a large premium on data quality and the ability to extract it through their huge investments in IT infrastructure and financial reporting, that it has in some ways forced leadership to “take it’s eye off the ball” with respect to the way in which that data is operationalized.

So from the perspective of using the data to effect smarter operational decisions, I’d say the successes are few and far between.

Of course, you can google any of the “big 3″ IT vendors and find a myriad of testimonials about how much better their decision making processes have gotten. But look at who’s doing the speaking in the majority of cases. It is largely from the Financial and IT communities, where  the changes have been most visible. But it’s in many of these same companies where operating executives and managers still clamor for better data and deeper insights.

So while at certain levels, and in certain vertical slices of the business, the organization is becoming more satisfied with its reporting capabilities, translating that information into rich insights and good fodder for problem solving still poses a great challenge. And unfortunately, better systems, more data, and more tools will not begin to bridge that gap until we get to the heart of some deeper cultural dynamics.

Needed: A new culture of “problem solvers”

Early in my career, I was asked to follow and accept what appeared to me at the time to be a strange “mantra”: “If it ain’t broke, ASK WHY?” That sounded a little crazy to me having grown up around the similar sounding but distinctly different phrase: “If it aint’t broke, DONT fix it”.

That shift in thinking took a little getting used to, and began to work some “muscles” I hadn’t worked before. For things that were actually working well, began asking ourselves “why?”. At first, we began to see areas where best practices and lessons learned could be “exported to other areas. But over time, we quickly learned that what appeared to be well functioning processes, wasn’t so well functioning after all. We saw processes, issues, and trends that pointed to potential downstream failures. In essence, we were viewing processes that were actually broken, but appeared to be A-ok because of inefficient (albeit effective) workarounds.

“Asking why?” is a hard thing to do for processes that appears to be working well. It goes against our conventional thinking and instincts, and forces us to ask questions…LOTS of questions. And to answer those questions requires data…GOOD data. Doing this in what appeared initially to be a healthy process was at first difficult. You had to dig deeper to find the flaws and breakdowns. But by learning how to explore and diagnose an apparently strong processes, doing that in an environment of process


failure became second nature. In the end, we not only learned how to explore and diagnose both: The apparent “good processes”, and those that were inherently broken. And for the first time in that organization, a culture of problem solving began to take root.

Prior to that point, the organization looked at problems in a very different way. Performance areas were highlighted, and instinctively management proceeded to solve them. Symptoms were mitigated, while root causes were ignored. Instead of process breakdowns being resolved, they were merely transferred to other areas where those processes became less efficient. And what appeared to be the functioning parts of the business, were largely overlooked, even though many of them were headed for a” failure cliff”.

Indication, Analysis, and Insight

Few organizations invest in a “culture of problem solving” like the one I describe above. Even the one I reference above, deployed these techniques in a selected area where leadership was committed to creating that type of environment. But throughout industry, the investment in generating these skills, abilities and behaviors across the enterprise, pales in comparison to what is invested annually in our IT environment. And without bringing that into balance, the real value of our data universe will go largely unharvested.

There are a myriad of ways a company can address this. And some have. We can point to the icons of the quality movement for one, where cultures were shaped holistically across whole enterprises. More recently, we’ve seen both quality and efficiency (more critical to eliminating waste and driving ROI) get addressed universally within companies through their investments in the Six Sigma, and more recent Lean movements.

But if I had to define a place to start (like the business unit example I described above), I would focus on three parts of the problem solving equation, that are essential to building the bridge toward a more effective Enterprise Performance Management process.

  • Indication– We need to extend our scorecards and dashboards to begin covering more operational areas of our business. While most of us have “results oriented” scorecards that convey a good sense of how the “company” or “business unit” is doing, most have not gone past that to the degree we need to. And if we have, we’ve done it in the easier, more tangible areas (sales, production, etc). Even there however, we focus largely on result or lagging indicators versus predictive or leading metrics. And in cases where we have decent data on the latter, it is rarely ever connected and correlated with the result oriented data and metrics. How many companies have truly integrated their asset registers and failure databases with outage and plant level availability? How many have integrated call patterns and behavioral demographics with downstream sales and churn data? All of this is needed to get a real handle on where problems exist, or where they may likely arise in the future.
  • Analysis– When many companies hear the word “analysis”, they go straight to thinking about how they can better “work the data” they have. They begin by taking their scorecard down a few layers. The word “drill down” becomes synonymous with “analysis”. However, while they each are critical activities, they play very separate roles in the process. The act of “drilling down” (slicing data between plants, operating regions, time periods, etc.) will give you some good indication where problems exist. But  it is not  “real analysis” that will get you very far down the path of defining root causes and ultimately bettersolutions. And often, it’s  why we get stuck at this level. Continuous spinning of the “cube” gets you no closer to the solution unless you get there by accident. And that is certainly the long way home. Good analysis starts with good questions. It takes you into the generation of a hypothesis which you may test, change and retest several times. It more often than not takes you into collecting data that may not (and perhaps should not) reside in your scorecard and dashboard. It requires sampling events and testing your hypotheses. And it often involves modeling of causal factors and drivers. But it all starts with good questions. When we refer to “spending more time in the problem”, this is what we’re talking about. Not merely spinning the scorecard around its multiple dimensions to see what solutions “emerge”.
  • Insight– I’d like to say when you do the above two things right, insights emerge. And sometimes they do. But more often than not, insights of the type and magnitude we are looking for are usually not attainable without the third leg of this problem solving stool. Insight requires its own set of skills which revolve around creativity, innovation, and “out of the box” thinking. And while some of us think of these skills as innate, they are very much learnable. But rather than “textbook learning” (although there are some great resources on the art of innovation that can be applied here), these abilities are best learned by being facilitated through the process, watching and learning how this thought process occurs, and then working those skills yourself on real life problems.

Dont forget “line of sight”

A few days ago I wrote a post on the concept of “line of sight” integration of your performance management content and infrastructure. It’s important here to reinforce the importance of tracking all of this back to that underlying construct.

The process of operationalizing information, is but one of many in the “line of sight” chain from your company’s vision, to the operational solutions that manifest here. And this process of operationalizing change is only a beginning of the journey you will make to translating these gains into ROI for the business (what I’ve referred to before as “value capture” or “value release”).

So as you navigate your path through the above activities, its useful to keep it in context and remember that the desired end state is to enable your business to see that clear “line of sight” from the very top of the organization right down to the work-face.

* * * * * * * * * * * * * * * * * *

There’s not enough space in a post like this to elaborate as much as we could on each of these. And creating real cultural change clearly involves more than a few quick bullet points. But as has been my tradition in this blog, my intent is to introduce you to principles and techniques that can get you started on this journey, or increase the ability for you to navigate the road your on.

b

Author: Bob Champagne is Managing Partner of onVector Consulting Group, a privately held international management consulting organization specializing in the design and deployment of Performance Management tools, systems, and solutions. Bob has over 25 years of Performance Management experience and has consulted with hundreds of companies across numerous industries and geographies. Bob can be contacted at bob.champagne@onvectorconsulting.com