Data, Metrics, and Information- Are we better off than we were 4 years ago?

Data, data…all around us…

Most of the projects I work on day in and day out involve data to varying degrees. I use data quite extensively in all of the assessments I do on organizational and operational performance. I use it heavily whenever I benchmark a company’s processes versus a comparable peer group. Data is at the very core of any target setting process. And, of course, data is (or at least should be) the beginning, and a continuous part of any gap analysis and any subsequent improvements that follows.

Today, the hunger that organizations have for good data has reached such unprecedented levels, that whole industries have developed in and around the domain of  what we now call “Business Intelligence” or BI. Having consulted to organizations over the last three decades, I’ve seen this hunger level increase steadily throughout the entire period. But no more so than in the past few years.

However, despite all the gyrations that we’ve gone through over the years, one of the first things I hear from C-Suite Executives is that they still feel  “Data rich and information poor”. So I’ll start this post off in the words of late President Ronald Regan by asking, “Are we better off or worse off than we were 4 years ago (in terms of translating data into useful and actionable information)?”

So are we better off than we were 4 years ago?

As any good politician, I would have to hedge a bit, and say yes, and no. And appropriately so I think.

We are most certainly better in our ability to “access” the data. If you’ve lived through the same decades as I have , you will remember the painstaking efforts we all made to extract data out of those proverbial “source systems” (when “SAS routines” had nothing to do with the SaaS of today). Everything from the data inside of our source systems, to the tools we use to access the data, to the ways in which we report and visualize the results has moved forward at lightening speed. And so, from that standpoint, we are, in fact, better off.

But on the other side of the coin, our tools have, in most cases, outpaced the abilities of our organizations and their leadership to truly leverage them. At a basic level, and in part because of the technology itself, we often have more data than we know what to do with (the proverbial “data overload”). Some would say that this is just a byproduct of  how wide the “data pipe” has become. And at some level, that’s hard to argue.

But I think the answer goes well beyond that.

“Data rich, information poor”…still?

In large measure, yes. The bigger issue in my view is the degree to which the organization’s skills and cultural abilities enable (or better said, disable) them to effectively utilize data in the right ways. Most companies have put such a large premium on data quality and the ability to extract it through their huge investments in IT infrastructure and financial reporting, that it has in some ways forced leadership to “take it’s eye off the ball” with respect to the way in which that data is operationalized.
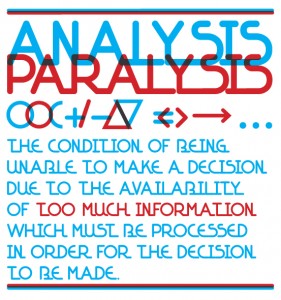
So from the perspective of using the data to effect smarter operational decisions, I’d say the successes are few and far between.

Of course, you can google any of the “big 3″ IT vendors and find a myriad of testimonials about how much better their decision making processes have gotten. But look at who’s doing the speaking in the majority of cases. It is largely from the Financial and IT communities, where  the changes have been most visible. But it’s in many of these same companies where operating executives and managers still clamor for better data and deeper insights.

So while at certain levels, and in certain vertical slices of the business, the organization is becoming more satisfied with its reporting capabilities, translating that information into rich insights and good fodder for problem solving still poses a great challenge. And unfortunately, better systems, more data, and more tools will not begin to bridge that gap until we get to the heart of some deeper cultural dynamics.

Needed: A new culture of “problem solvers”

Early in my career, I was asked to follow and accept what appeared to me at the time to be a strange “mantra”: “If it ain’t broke, ASK WHY?” That sounded a little crazy to me having grown up around the similar sounding but distinctly different phrase: “If it aint’t broke, DONT fix it”.

That shift in thinking took a little getting used to, and began to work some “muscles” I hadn’t worked before. For things that were actually working well, began asking ourselves “why?”. At first, we began to see areas where best practices and lessons learned could be “exported to other areas. But over time, we quickly learned that what appeared to be well functioning processes, wasn’t so well functioning after all. We saw processes, issues, and trends that pointed to potential downstream failures. In essence, we were viewing processes that were actually broken, but appeared to be A-ok because of inefficient (albeit effective) workarounds.

“Asking why?” is a hard thing to do for processes that appears to be working well. It goes against our conventional thinking and instincts, and forces us to ask questions…LOTS of questions. And to answer those questions requires data…GOOD data. Doing this in what appeared initially to be a healthy process was at first difficult. You had to dig deeper to find the flaws and breakdowns. But by learning how to explore and diagnose an apparently strong processes, doing that in an environment of process


failure became second nature. In the end, we not only learned how to explore and diagnose both: The apparent “good processes”, and those that were inherently broken. And for the first time in that organization, a culture of problem solving began to take root.

Prior to that point, the organization looked at problems in a very different way. Performance areas were highlighted, and instinctively management proceeded to solve them. Symptoms were mitigated, while root causes were ignored. Instead of process breakdowns being resolved, they were merely transferred to other areas where those processes became less efficient. And what appeared to be the functioning parts of the business, were largely overlooked, even though many of them were headed for a” failure cliff”.

Indication, Analysis, and Insight

Few organizations invest in a “culture of problem solving” like the one I describe above. Even the one I reference above, deployed these techniques in a selected area where leadership was committed to creating that type of environment. But throughout industry, the investment in generating these skills, abilities and behaviors across the enterprise, pales in comparison to what is invested annually in our IT environment. And without bringing that into balance, the real value of our data universe will go largely unharvested.

There are a myriad of ways a company can address this. And some have. We can point to the icons of the quality movement for one, where cultures were shaped holistically across whole enterprises. More recently, we’ve seen both quality and efficiency (more critical to eliminating waste and driving ROI) get addressed universally within companies through their investments in the Six Sigma, and more recent Lean movements.

But if I had to define a place to start (like the business unit example I described above), I would focus on three parts of the problem solving equation, that are essential to building the bridge toward a more effective Enterprise Performance Management process.

  • Indication– We need to extend our scorecards and dashboards to begin covering more operational areas of our business. While most of us have “results oriented” scorecards that convey a good sense of how the “company” or “business unit” is doing, most have not gone past that to the degree we need to. And if we have, we’ve done it in the easier, more tangible areas (sales, production, etc). Even there however, we focus largely on result or lagging indicators versus predictive or leading metrics. And in cases where we have decent data on the latter, it is rarely ever connected and correlated with the result oriented data and metrics. How many companies have truly integrated their asset registers and failure databases with outage and plant level availability? How many have integrated call patterns and behavioral demographics with downstream sales and churn data? All of this is needed to get a real handle on where problems exist, or where they may likely arise in the future.
  • Analysis– When many companies hear the word “analysis”, they go straight to thinking about how they can better “work the data” they have. They begin by taking their scorecard down a few layers. The word “drill down” becomes synonymous with “analysis”. However, while they each are critical activities, they play very separate roles in the process. The act of “drilling down” (slicing data between plants, operating regions, time periods, etc.) will give you some good indication where problems exist. But  it is not  “real analysis” that will get you very far down the path of defining root causes and ultimately bettersolutions. And often, it’s  why we get stuck at this level. Continuous spinning of the “cube” gets you no closer to the solution unless you get there by accident. And that is certainly the long way home. Good analysis starts with good questions. It takes you into the generation of a hypothesis which you may test, change and retest several times. It more often than not takes you into collecting data that may not (and perhaps should not) reside in your scorecard and dashboard. It requires sampling events and testing your hypotheses. And it often involves modeling of causal factors and drivers. But it all starts with good questions. When we refer to “spending more time in the problem”, this is what we’re talking about. Not merely spinning the scorecard around its multiple dimensions to see what solutions “emerge”.
  • Insight– I’d like to say when you do the above two things right, insights emerge. And sometimes they do. But more often than not, insights of the type and magnitude we are looking for are usually not attainable without the third leg of this problem solving stool. Insight requires its own set of skills which revolve around creativity, innovation, and “out of the box” thinking. And while some of us think of these skills as innate, they are very much learnable. But rather than “textbook learning” (although there are some great resources on the art of innovation that can be applied here), these abilities are best learned by being facilitated through the process, watching and learning how this thought process occurs, and then working those skills yourself on real life problems.

Dont forget “line of sight”

A few days ago I wrote a post on the concept of “line of sight” integration of your performance management content and infrastructure. It’s important here to reinforce the importance of tracking all of this back to that underlying construct.

The process of operationalizing information, is but one of many in the “line of sight” chain from your company’s vision, to the operational solutions that manifest here. And this process of operationalizing change is only a beginning of the journey you will make to translating these gains into ROI for the business (what I’ve referred to before as “value capture” or “value release”).

So as you navigate your path through the above activities, its useful to keep it in context and remember that the desired end state is to enable your business to see that clear “line of sight” from the very top of the organization right down to the work-face.

* * * * * * * * * * * * * * * * * *

There’s not enough space in a post like this to elaborate as much as we could on each of these. And creating real cultural change clearly involves more than a few quick bullet points. But as has been my tradition in this blog, my intent is to introduce you to principles and techniques that can get you started on this journey, or increase the ability for you to navigate the road your on.

b

Author: Bob Champagne is Managing Partner of onVector Consulting Group, a privately held international management consulting organization specializing in the design and deployment of Performance Management tools, systems, and solutions. Bob has over 25 years of Performance Management experience and has consulted with hundreds of companies across numerous industries and geographies. Bob can be contacted at bob.champagne@onvectorconsulting.com

Visualizing Waste

I received some good feedback via comment, twitter, and email on yesterday’s post regarding what I referred to as  “Metric Hoarding (KPI overload). Some of that feedback was from clients facing that very challenge today, identifying well with the issue of “KPI overload”. Many of you offered your own thoughts from your own experiences which is always helpful in refining and building upon my own ideas and solutions. I guess that’s the whole purpose of social and collaborative media. Pretty cool stuff.

But one reader/ twitter colleague (Redge – twitter @versalytics), and author of his own blog “Lean Execution” )used a pretty compelling analogy in his feedback to me. TIn amplifying my point about “KPI overload” and the need for some deliberate “pruning” of your metrics database, he used the analogy of “people who leave their windshield wipers running after the rain has stopped“. He used this metaphorically of course, to highlight a scenario where a process continued long after the result was accomplished.

And that was the main point I was making in yesterday’s post –That when we keep reporting on things long after the report or measure is unnecessary, we produce waste! And waste impacts everything from productivity to profitability. It destroys organizations and their cultures from within, and can propagate like a cancer if left unresolved.

I think that’s why analogies like this are so useful. They are so simple to understand, yet so powerful in getting leaders and managers to “look in the mirror”, do some deep reflection, and begin to see how their own processes may be  driving waste within their own companies.

As an aside …

If you’ve ever worked around a real Lean practitioner, you’ll quickly realize that are no shortages of these metaphors. So much so, that I’m sure there exists a reference book somewhere that has consolidated every lean metaphor that can be associated with waste into one single volume. In addition to all of the great value that the Lean discipline has delivered to industry in recent years through their tools, methods, analytic frameworks and facilitative culture of problem solving; the thing I’ve learned the most from them is their ability to simplify complex problems and increase the likelihood of a good solution.

In my view, visualizing the problem is critical in identifying, understanding, and ultimately solving it. Most often, we use visualization in a positive way (helping us see a bolder aspiration,  clearer pathways, and bigger success). Golfers, for example, always try and visualize their shot (shape, trajectory, landing spot etc.) during their pre-shot routine. And I can honestly say, that it does help- mostly because it clears negative thoughts and fear from the mind right before you have to execute. Using positive visual cues does work.

In much the same way as a positive metaphor helps us identify with success, “problem oriented” ones can work just as effectively; helping us see problems more clearly and begin to understand their drivers. We’ve all seen or heard these types of analogies from time to time:

  • The driver who keeps getting a flat in their front left tire, and over time has masters his “productivity” in “changing the tire” (faster and smarter at changing the tire)…all the while failing to ask why the tire was blowing out in the same spot every time.
  • The man who keeps falling an a hole on his way to work, and focuses his energy on how to climb out faster …rather than simply changing his route!
  • Why car washes have people towel drying your car long after after the mechanical dryer has been installed.

All of these analogies paint a clear picture of the problem, while also making the problem appear less daunting to solve. They “clear the fog” (so to speak…:) ) and help get us more quickly to designing and deploying a better solution.

So what are some other good visual cues that can help identify more sources of waste within our companies and our lives?

-b

Author: Bob Champagne is Managing Partner of onVector Consulting Group, a privately held international management consulting organization specializing in the design and deployment of Performance Management tools, systems, and solutions. Bob has over 25 years of Performance Management experience and has consulted with hundreds of companies across numerous industries and geographies. Bob can be contacted at bob.champagne@onvectorconsulting.com

Too Many KPI’s?- Tips for Metrics Hoarders…

One of the questions I get asked often by my clients is “just how many KPI’s and metrics are enough for effective Performance Management to occur?”

I think most of them realize that there is no hard and fast rule, and probably no “right answer”. Some may just be trying to find out if they are “in the right ballpark”. But I think the majority of those asking this question are asking it rhetorically. That is, they believe “in their gut” that their measurement system has gotten a bit unwieldy, and is starting to create breakdowns, confusion and loss of whatever  momentum they once had. And based on my experience, they’re usually right.

Are we talking KPI’s or Metrics?

Now some of the Performance Management “purists” out there might say that we first must know what we’re  talking about when we say the words ‘too many measures’. Are we talking about KPI’s or performance metrics? Are we talking “business” metrics” or “operating metrics“? Are we talking about “data elements” (inputs), or are we talking about the calculated metrics that show up on our dashboards and scorecards that utilize these data in their algorithms? Or are we simply talking about operating data and variances that we routinely report and track in our budgeting and forecasting environments?

For today’s purpose, I’m going to stay clear of those distinctions. Mainly, because having too many measures can cause problems regardless of the type of measure it is. But also  because we’ve had more than enough posts this week (including mine)  that have discussed and debated what I would call “the semantics” or “the lexicon” of EPM. (Dashboards versus Scorecards, Enterprise vs. Portfolio Performance Management, Business Performance Management vs. the historical HR view of Performance Management (which interestingly suggests that HR is trying to manage something OTHER than “business results”- huh?). I even saw a post yesterday on “Application” Performance Management which suggests to me that we are dangerously close to every business function or process needing its own definition of Performance Management (along with the associated buzzwords and community of followers) for it to be effective. I’m sure there will no doubt be plenty of columns and blogs that will address these, and  the myriad of  new disciplines that emerge  from continued innovation and new technology in the PM arena. No need to waste any more time (other than what I just did!) on that here.

Instead, try to answer the question more directly based on my own experiences. I’ll also use these experiences to reveal the implications of going too far beyond what I believe is that optimal number of KPI’s that should be used to manage the enterprise.

Some “rules of thumb” from my experience…

If I were pressed to answer the question “how many KPI’s are enough?” directly, I would of course  “hedge” a little by opening with the “well, it depends” caveat. But I would still be comfortable laying out some broad rules of thumb that I think reflect the needs of an “average company”.

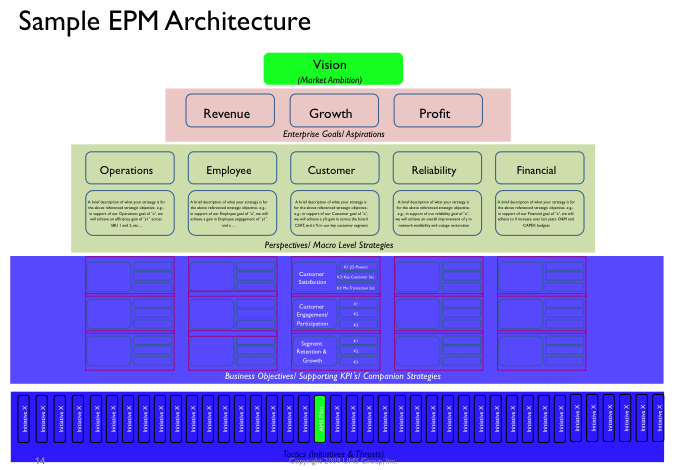
For example, let’s assume the business has a clear and compelling vision and mission, a handful of established  business goals, and subscribes to the ‘balanced scorecard’ notion of 4 or 5 perspectives (categories or stakeholder groupings if you will) within which goals, objectives, strategies and KPI’s are ultimately managed (i.e. Customer, Financial. Employee, Operating, etc.). See levels 1-3 of the below graphic.

Within that scenario, I would say that the business should have a few key objectives within each of those groupings (left side of Level 4 boxes below). For example, in the Employee Area, one objective might be to “Maintain a Safe Workplace”, while another may be to have “Motivated and Engaged Employees”. My experience is that there are usually 2-5 (max) objectives for each major perspective or grouping. For each objective, you would then have anywhere from 1-3 KPI’s (right side of level 4 boxes below) to measure the success of each.

In my experience, that’s as far as I go with what I call Key Performance Indicators at the corporate level. Do your own math, but my experience is a total of 20 to 30 KPI’s max. Larger companies with multiple business units (especially if highly diversified) may have significantly more than that, while smaller organizations with more limited focus may have less. But again, 20-30 is a good rule of thumb.

A Sample EPM Architecture

That notwithstanding, this is always “context dependent”. For example, if a company decides to replicate this infrastructure in each business unit, the numbers would increase proportionally. But the number of “corporate KPI’s“, those managed at the Enterprise Level would still lie in the 20-30 range

If you’re jumping out of your seat right now, you may be one of those who believes at your core, that KPI’s should be a very small set of things that are “supercritical” to business success (as in 5 or 10, not 20 or 30). I’m not going to take issue there, because I happen to buy into that principle. In fact, I often will extract 5-10 indicators that for the business may be truly “key” or very essential to their success. But for me, I tend to view these as strategic KPI’s or goals that distinguish them from the full suite that I referred to earlier. The full suite (universe)  of KPI’s for the business still falls in the 20-30 range.

Now, assuming many of the KPI’s are “calculated” off of other data or metrics, and assuming that the company would desire to view each by a number of different dimensions (time period, segment, geography, etc.), its easy to see the number of data elements (whether they are viewed as metrics, indicators, or source data) can jump well into the thousands or even tens of thousands.

It’s all part of the “Roadmap”

Ok- maybe I went into the jargon and distinctions more than I wanted to, but I wanted to give you a sense of why I believe the magic number of KPI’s (KEY performance indicators) is where I placed it…in the 20-30 range. And to do that, I guess I did need to define and explain the framework a little. Hopefully, the  chart above gave you a sense of how that architecture fits together.

But even if you buy into the structure I laid out above, there will always be variants. So don’t feel completely bound by the structure or words that I am using here, or the “rule of thumb” benchmark I’ve laid out. The exact number will always be unique to a business environment, but that number should be part of an overall roadmap of how you want to manage your EPM program.

The reason for the type and number of KPI’s you select, should be to create balanced focus and direction, while aligning to your desired end point. Every business needs to have a small but balanced set of management perspectives (i.e. more than one) that they manage within, but not so many that it gets diluted and distracting. Same with the objectives you set, and the KPI’s that support them. There need to be enough to reflect business focus and priority, while stopping at the point at which it creates clutter and confusion. For me, that equates to a KPI number in the 20-30 range.

And while drill downs and analytics will add exponentially to the number of metrics and data points accessed, they still reside in a structure which revolves around those 20-30 KPI’s. There are also some psychological reasons for the why we break our objectives and measures  into convenient little chunks of 3-5 within each perspective, and sometimes smaller chunks within those, but that is a secondary factor that only amplifies the rule of thumb that I laid out.

Consequences of “metrics overload”…

As I said earlier, my experience is that when someone asks me a question around the number of KPI’s they should have, it’s usually because there are in fact too many, and that quantity itself has created a dilution of focus. Or maybe its because the structure within which they reside is losing clarity and alignment. Usually it’s a combination of the two, and one drives the other.

But the underlying cause of all of this is usually lack of preparation on the front end. Perhaps the organization jumped straight into a technology fix for what really is a process and cultural challenge. In these cases, the organization may have procured a tool that only works if you populate it with data. So they rapidly populate their dashboards and scorecards with as many metrics as they can think of, not considering the critical connections, relationships and architectural dynamics at play.

Another reason is lack of ownership for the process. Sometimes it starts well, but without continued governance of the process, each business unit runs with their own vision of what “their” scorecard should look like. Sometimes, a clear and cogent integrated architecture miraculously appears out of the ashes, but more often than not, you end up with several different views of what success looks like. Metrics end up being  misaligned, or worse, conflicting across multiple business units in the same organization.

Whatever the reason, the problems of “runaway metrics” often manifest because there really was no EPM “Program” to begin with (no unifying framework to build upon)–just a set of tools to report and analyze data, and if you’re lucky, a few guidelines for how to use “the tool”. In those environments, its not uncommon for us to find medium to large companies tracking hundreds or even thousands of things that middle and upper management refer to as KPI’s, without any real semblance of an EPM program or platform in place. And no matter what definition or distinction you want to use, that’s way too many.

And it only gets worse…

Complicating all of this, is day to day realities of management reassignments, the natural comings and goings associated with staff turnover, and sometimes major changes in leadership that can (and often should) initiate a change in course, along with the emergence of new navigational beacons and waypoints (i.e. new KPI’s). But rather than changing the structure of their EPM platform, and replacing one set of waypoints with the new ones, they simply layer the new set on top of the old.

At some point, the companies become what I call  “hoarders of metrics”, and before long, an otherwise harmless but impotent process, begins to look like utter chaos.

While the word “layers” often has a negative connotation, they are often useful in establishing an architecture for a solution, and by design, can actually create strength within the system. The architecture I describe above, and the type of “line of sight” thinking I described in yesterday’s post are examples of how this can be used to strengthen your EPM program.

But when the layering is done without a deliberate structure and blueprint, these layers (new metrics on top of old, bad metrics on top of good) can, and often does, cause the system to collapse under its own weight.

Getting it back under control

Here are a few guidelines and “healthy” practices for getting your measurement framework leaner, better aligned, and back into focus:

  • Know where you are today-Without getting caught up in all the lingo, do a simple inventory of your process vis a vis the framework I laid out above. Ask yourself, how many objectives you have within each key domain. How many top level metrics are there that support these objectives (things that senior management routinely uses to monitor and talk about)? Are there metrics we track that are redundant and perhaps don’t support any of our objectives? Are some objectives missing the metrics needed to track their achievement? What does that picture look like for you in terms of structure and number of KPI’s, and is some “pruning” warranted?
  • Commit to an Architecture – We all acknowledge the advice “measure twice, cut once”. That’s even more important here, as the organization can only withstand a failure or two in trying to get a performance management system in place without experiencing major “cultural fallout”. Continuing to “experiment” with measurement and KPI’s without having an architecture and blueprint to guide that process (even if its a crude one) is setting the stage for many of the above challenges and breakdowns.
  • Understand the role of the KPI (versus other parts of the structure)- I’m not talking about getting hell bent on semantics, but I do think there is some value in teaching the organization the difference between a KEY performance indicator, and the myriad of other data and statistical fodder that may be used within the overall system. Use the rule of thumb I laid out earlier to guide and test whether this distinction is sinking in.
  • Build down, Not around– If I had to pick a direction to build your EPM architecture, I would say start at the top and work down. Once you are at the KPI level, you should be able to start allocating out accountabilities for their achievement, and then, if your culture supports it, those accountabilities can be disbursed in a measurable way to your staff via individual and work team metrics, from which appraisals and reward structures can then be linked. I differentiate this from the notion of building “around”, in which I mean taking the concept of EPM (a prototype) and repeatedly testing it out in new areas and business functions, without any clear roadmap or enterprise structure in place. While that can certainly kick start measurement activity and get things moving, it can also propagate some bad thinking if the underlying architecture and core practices at the enterprise level are not in place.
  • Establish a vetting process for new metrics– Its important to recognize why people develop metrics in the first place. We’d like to think that its all from a noble ambition to help the company improve, out of a pure hunger for data. But it goes way beyond that. People develop metrics for everything from defending their turf to getting their point heard. Since data is now the currency through which corporate truth in now established (which is a good thing), so don’t be surprised when the number of metrics begins expanding exponentially. At that point though, you want to make sure your core system does not get infected with junk; so to prevent that, make sure you have a process or checklist to vet any addition of new metrics into the corporate framework.
  • Set aside time for “pruning”-Every strategic planning process, should have a step in which KPI’s and the underlying performance architecture for the business is reviewed. Measures that are no longer relevant, or no longer adding value should be dropped. Unclear linkages upward and downward should be evaluated and strengthened. New business objectives should come into play along with their companion KPI’s, but more often than not, they should end up replacing a measure that may have gone away or diminished in importance.
  • Don’t be afraid to “cycle down” a KPI – Sometimes, pruning won’t involve eliminating a measure entirely. For example, if your ambition was to imporve or optimize a measure, and you’ve now achieved the optimal point, it may be time to simply go into maintenance mode and start reporting on a lower frequency (weekly to monthly, monthly to annually, and so forth). Think about how many of your measures don’t change one hill of beans throughout the year, yet they continue to take up valuable “real estate” on your dashboards and the often scarce mind-space of your executive team.

Anyone who does yard work or gardening knows that “pruning”, while it involves cutting back, is really designed to produce a healthier and more vibrant plant, shrub or tree. And rather than producing growth outward (taller and wider), it instead encourages the growth the be “fuller” and often “healthier” in future growing seasons. Next year’s growth fills in those “holes” that may have been unsightly, and encourages a more deliberate  growing and robust pattern. Hence, your long term plans for the garden and landscape start manifesting and coming to life the way they were initially envisioned.

That same kind of annual pruning and renewal process can be just as effective in establishing a healthy growing pattern for your EPM initiative, a pattern that can otherwise get interrupted by the confusion, distraction and conflict caused by an unwieldy and burdensome performance measurement process. And, as with everything from gardening to weight gain to maintenance of our autos, its always easier to manage it along the way rather than waiting until there is a problem.

And with that, I’ll wish you all happy “KPI pruning”!!

-b

Author: Bob Champagne is Managing Partner of onVector Consulting Group, a privately held international management consulting organization specializing in the design and deployment of Performance Management tools, systems, and solutions. Bob has over 25 years of Performance Management experience and has consulted with hundreds of companies across numerous industries and geographies. Bob can be contacted at bob.champagne@onvectorconsulting.com

Line of Sight: The essential ingredient in “world class” Performance Management…

What is “Line of Sight”, and why does it matter?

For me, the words “line of sight” conjure up a lot of mental images ranging from the fighter jet “locking on” to a hostile enemy aircraft,  to a rifle shot zero-ing in on a desired target, to a satellite vector controlling a local GPS receiver in your vehicle.

Whatever image is produced for you when you hear these words, it is likely to be a good metaphorical reference that will be helpful in designing or refining your Performance Management system.

For me “line of sight” thinking is one of the most important principles in the whole Performance Management discipline. And  it is the absense of that thinking that  is creating many of the challenges and failures with our organizations.

When I describe this concept to my clients who are responsible for EPM within their organizations, most will admit that it is the very thing that is lacking for them. They may have the best metrics, systems, and reporting structures known to man, but without that “line of sight” connectedness, it may all be for naught.

For example, how many times do we hear employees and managers resist change because they don’t think management even has a defined strategy? Or that the things they are measured on really produce value to the bottom line? Or worse yet, that accountabilities (where they exist) are simply ideas dreamed up by middle management with no connection to what the executives really want, or what is needed by the business? Broken linkages can occur at any of these levels, and most anywhere in between.

We spend millions on key elements of our Performance Management program without ever tying those parts together. In any EPM program, there consists lots of components and moving parts, all of which cost money and time to build (IT tools, HR tools, Dashboards, etc.) But think of spending all of that money and time, but failing to establish the critical nodes or tie ins that make the system work cohesively. Or having barriers to those systems that prevent them from functioning effectively.

Think of  those infamous GPS signals that go out or “recalculate” at the very time you are at a critical juncture in your journey. Or as I read in a good post a few days ago, the frustration you feel when you get into your rental car and can’t get the GPS connection until you’re already on the highway going the wrong way (simply because they don’t work while in the rental car garage because of the concrete structure). When that GPS linkage breaks, it is of no value to anyone. For me, perhaps the most frustrating thing is when I am on the golf course, and my “personal (GPS) caddy” suddenly has a “senior moment” (failed connection) right before a critical shot! Talk about slowing the “pace of play”!!!

So where are these missing linkages?

So what are those “missing links” in our Performance Management programs that can destroy these critical linkages? Here are a few that come to mind for me:

  • Absence of a clear compelling vision for the business, and/or failing to communicate it effectively
  • Failing to tie your mission and objectives with your vision in a clear and cohesive way
  • Having a laundry list of KPI’s that are seemingly random, inconsistent, or otherwise “detached” from the objectives they support
  • The presence of KPI’s that lack clarity as to what they are, or what comprises them (I’m thinking of those convenient “indexes” that roll up several measures (via an algorithm), and ultimately translated acronym that only a select few managers can even pronounce, not to mention understand!!)
  • Failure to understand or communicate where the underlying data even comes from (produces doubt and undermines the “perception” of data confidence even if the data are valid and reliable!)
  • Lack of connection between each KPI, and the initiatives that support their improvement (targeted improvement projects, new systems or technology deployments, large CapEx programs or projects, etc.)
  • Failure to link individual performance metrics, appraisals, and employee development efforts to your underlying KPI’s
  • Absence of a back-end “value capture” process that ensures completed initiatives produce their expected ROI (i.e. a real, measureable and visible change in a KPI AND the associated impact on the bottom line (e.g. EBITDA, Market Share, Revenue Growth, etc.).
  • Inability to effectively link reward structures to all of the above.

These are only a few that are “top of mind” for me at the moment. But the list goes on and on.I encourage you to reflect on where these breakdowns occur in YOUR organization. Only then can you deploy some critical fixes, and apply some of the essential glue that is needed between the fractured linkages.

The missing piece of the puzzle?

What causes “line of sight” breakdowns ?

Of course, the failure to establish these linkages can occur for several reasons, some of which are not apparent on the surface.

  • First, certain parts of the process may in fact be missing all together. For example, while we all think we may have a “clear vision” for the business, most do not. Clarity is one thing. But making it an aspiration that is both compelling and engaging is much more essential to your downstream success. Without it, those follow-on connections become far more difficult to establish, and can be like trying to bind wood to air.
  • Another reason, is that often many different organizations and processes have responsibility for different pieces of the EPM puzzle. You can read about this in another recent post about the impact of this, and how to begin linking these processes together. But suffice it to say, we’re talking about everything from IT to HR, and Corporate Strategy to Finance, and many processes in between. Having accountability for the entire EPM process is the critical first step in repairing this type of integration breakdown.
  • Finally, but on a related note, a very significant problem resides in the way the organization treats the management and execution of projects (I’m talking about those small improvement projects, to the largest capital projects that exist within the enterprise). This is part of a much bigger topic which I call “commitment management” which I have written about previously- which at its core, is really all about the organization’s culture and how it manages commitments and “promises to deliver” (and what happens when they do and don’t deliver). For many organizations, the linkage between “project management” and “performance management” is one that is rarely even thought about in this context. And as unfortunate as it may be (albeit unintentional I’m sure), consultants and IT vendors are in large measure actually responsible for this lack of clarity through the myriad of solutions (and their variants) that they continue to flood the market with (EPM, BPM, PPM, BI, etc.). I mean, come on…really?

What can I do about it ?

Just as I indicated when discussing where the breakdowns reside, the list of causes can be much broader and more complex than simply those referenced above. And many of them can be just as debilitating. But starting this dialogue, and initiating the thinking around these breakdowns and causes is a clear first step.

So I encourage you and your team to do a little bit of serious thinking on this topic and create your own inventory of where and why these disconnects occur in your business. We at onVector have done a lot of this work and  developed what we call “Performance Integration Maps” that help our clients identify, visualize and address these types of gaps in their Performance Management program. But whether you use a consultant to assist in thes process, or do it yourself, the important thing is to make it a priority and take the first step.

Resolving the issues can also be a challenging endeavor, and can sometimes take months to years to get the culture aligned in a way that supports it. But the value can be enourmous to the achievement of your organizational objectives, KPI’s and the associated bottom line impact. And when that type of culture and thinking is in place, it becomes an institutionalized “way of life” for the business.

Imagine for a moment the magnitude of investment, and time it took for you to get the various component parts of your performance management process in place. For many of us, “line of sight” can be the key ingredient in allowing you to harvest that impact and ROI that you initially desired. And to moving forward without it, is to allow your team to continue flying blind.

-b

Author: Bob Champagne is Managing Partner of onVector Consulting Group, a privately held international management consulting organization specializing in the design and deployment of Performance Management tools, systems, and solutions. Bob has over 25 years of Performance Management experience and has consulted with hundreds of companies across numerous industries and geographies. Bob can be contacted at bob.champagne@onvectorconsulting.com
Building Sustainability Into Your Performance Management Program

Like some of you, I always enjoy watching the final round of a good golf tournament on a Sunday afternoon, particularly if it’s a close race to the finish, or if there is someone I like to follow in the final few pairings with a decent chance to win. But I think the most enjoyable tournaments I’ve ever watched involved a good “comeback story”- whether it is the overwhelming underdog about to claim their first real victory, or the encore of an otherwise “past legend” of the game.

Such was the case this weekend watching the Northern Trust PGA stop at “Riviera” outside of Los Angeles. Normally, this past Sunday’s finish would have been one of those I viewed in the background , since most of the golfers I normally follow had already worked themselves out of the tournament by Friday afternoon.

Usually by Saturday evening, you know who is likely to be in contention, as those who are either struggling, or have taken steps in the wrong direction have moved themselves too far down the leaderboard to have a legitimate chance. Needless to say, as I approach that magical age of 50, having someone that I like to follow on the top of the leaderboard is becoming a rarity these days unless I’m watching the Senior Tour.

But this Sunday was different. For the first time in a while, two of the “older farts” that I like to follow were actually making a run at it. Those were  VJ Singh (47) and, none other than, Fred Couples (51)- the latter of whom I grew up watching as a kid. When I was in high school, I can remember watching “Freddy” come on the scene and, within a only few years, begin to contend with all the golf “Masters” of that era (literally).

In sports, “over 40″ is considered “old” and “over 50″ is usually considered “time for the senior tour”. Except for the “honorary” roles at a few of the Major events, it is very rare to see someone over 50 in contention on Sundays. And when they do, it is most notable. When these players beat the odds and simply  compete well (even if they don’t win)- Tom Watson at the recent British Open for example-it is a special moment. But when they win, it is literally something to behold- something reserved for true legends. In fact, a win from Fred this week would have made him one of only three golfers (alongside Snead and Floyd) to win in four different decades, a true measure of “sustainability”.

As it turns out, Fred didn’t win this week, due in large measure to a bad performance on a single hole which essentially took him out of contention, ultimately falling to the young Ausie, Aaron Baddeley.

One hole… that’s all it took to create a 3 stroke swing that killed most of the momentum built over 4 days and 65 holes of solid golf. Sad? A little. Here’s a guy over 50, riddled with a chronic back injuries, who routinely wins or “places” on the Senior Tour, and who was actually in contention with 6 holes to play alongside a guy half his age. Impressive any way you look at it.

And that is what got me thinking about SUSTAINABILITY. What is it that differentiates certain athletes to be able to sustain performance over literally decades? And how can we apply these lessons to business success, and perhaps our lives in general?

Interestingly, those athletes who sustain performance over many years, are sometimes those that never reach that elusive “#1 ranking” in there sport. They may have been #2 or #5 or even lower, but they were consistent in their performance over much longer durations, usually “hanging around” long after the #1’s had fallen or left the sport. Same with Businesses. Companies who may never achieve #1, can be just as successful by being in the “top few” (even the top decile or quartile) if they can perform at that level in a sustained and measured way.

So what is it that makes that difference? Here are five factors that I submit as key answers to that question.

  • Build “Around The Core”– Over the course of an athlete’s career, or a company’s history, the likelihood of going through multiple periods of change is almost certain, as is the probability that more than a few of those changes will be of large magnitude. But despite this, those who sustain their performance usually have a “core” that they develop and build around. For an athlete, this is usually referred to as a playing “style”- a golfer’s unique swing, a quarterback’s throwing motion, etc. And while that “style” can be tweaked or refined from time to time, the core elements of it usually transcend different periods of a career. For good businesses, this usually shows up in the form of vision and values. While specific missions, goals, KPI’s and strategies will no doubt change over time, the core vision and values, generally don’t.
  • Strategic Flexibility and Adaptability– Some may view this a little contradictory to the above point, but here is the distinction: While the core tends to remain stable, the strategies and tactics can, and should be somewhat fluid over time. Golfers and other athletes always “tinker” with different parts of their game and often solicit advice from coaches on what may be failing them at any particular point in time. They “adapt” their style to what may be needed to make themselves better. But rarely does this change the “core” of what defines them in terms of their long terms success. And when they do change something, its usually “off the course”. That is, they generally don’t change a fundamental strategy during the round, but rather do it on the range or in a practice round. When they “hit the course”, it’s generally all about execution. Businesses too, need to adapt to changing market conditions, buying patterns, economic climates, and numerous other factors; but at the same time protecting the core of what distinguishes their excellence.
  • Broaden the “Perspective”- My view of athletes who maintain sustainable success is that they do in fact modify their goals over time. I originally wrote this as their “openness and willingness to modify a target”, but that conveyed  more “weakness” than I really intended. It’s not that they change the target because they’re getting further into the lifecycle of their career, as much as it is changing the ultimate “perspective” and “horizon” around which they measure success. First time winners of the Superbowl start thinking in terms of career goals versus simply seasonal goals. Golfers start thinking about world rankings and career wins versus weekly tournament successes. No doubt, every one of these athletes wants to win week in and week out, but I suspect most would sacrifice a short term gain if doing so jeopardized a longer term aspiration.
  • Keeping the Team “Healthy”– It would be hard to talk about sports or business “dynasties” without talking about the importance of keeping the team in tact and healthy. For athletes, this means literally. Many an athlete has ended a career early because of injury. Stops and starts because of chronic injury is something that prevents sustainability. Sustainability requires a vigilance to keeping the body and mind healthy which usually takes an ultra-strong commitment to training on the field and off.  In business, the “healthy” team means doing your part as leaders to not only acquire the right talent, but to create an environment of nurturing ad development that supports retention and peak performance. It also means keeping “unhealthy” influences, behaviors and practices far away from the human capital you’ve invested so much to develop.
  • A Culture of Learning– As trite as it may sound, this may in fact be the most important common denominator of sustainable performers. Almost every “hall of fame” athlete we know appears to have that “hard wired” sense of learning built into them. It’s a hunger for learning that seems to disappear quickly after the initial successes of “one hit wonders”. But for sustainable leaders, that hunger for learning is almost obsessive. And the same is true of long term business success. It’s evident when you walk in the doors of these companies. Everything from the charts you see on the walls, to the type of conversation and dialog you witness, speaks of learning.

As always, these represent only a subset of what I believe are the most powerful differentiators of long term sustainable success.  I welcome your additions, comments and thoughts as well.

There are no doubt places in our performance management programs where we can apply these principles. Start with the core and build from there. Do you have that “solid core” of vision and values? Or is this something you constantly change from year to year. Are you flexible and adaptable with respect to your annual goals, objectives and KPI’s? Or have your operating objectives, measures, targets and strategies remained the same for years or even decades? As ironic and paradoxical as this is, many companies have this backwards. They constantly mess with the vision and values, yet they have objectives, measures and targets that rarely get challenged or updated over many years. That’s always an alarm bell for me.

But it shouldn’t stop there. For example, have you built the right perspectives and timeframes into your performance program? Do you have more than just short term goals for achievement? Do you also have longer term sustainability measures to complement that dimension of your scorecard? Have you used your performance management program as a tool to develop, nurture and retain your human capital? And have you really started down that road of continuous learning?

As I mentioned in a previous post, a good performance management program is not just about measures and metric reporting. It is about a holistic and integrated platform for building sustainable business success.

-b

PS- As for Freddy, best of luck at Augusta. I know he’ll be back. The decade is still young.

Author: Bob Champagne is Managing Partner of onVector Consulting Group, a privately held international management consulting organization specializing in the design and deployment of Performance Management tools, systems, and solutions. Bob has over 25 years of Performance Management experience and has consulted with hundreds of companies across numerous industries and geographies. Bob can be contacted at bob.champagne@onvectorconsulting.com