

You’d never drive only looking backwards…
Would you?
…Only if it’s a straight road, no traffic, and blue skies ahead; and even then, it’d be pretty dangerous and ill advised. But on any other road, doing that would almost certainly spell disaster.
It’s the same in business. And while it may sound like common sense, it’s amazing how many executives and operating managers are doing just that by the way they operate their performance management process.
Defining the metrics that guide your journey…
Over the past few decades, I’ve worked with hundreds of organizations to help drive their business improvement through the smart application of performance measurement and management practices. This work has literally run the gamut, from showing them how to use relevant benchmarks to supporting them in their target setting, to literally ripping apart and reconstructing their scorecards and dashboards.
While there are a lot of other facets to good performance management (many of which I discuss on this blog)- from establishing “line of sight” between corporate strategies and operating activities, to better integrating stakeholders within the EPM process (IT, HR, Finance et al)- the area in which my clients have had the highest impact still lies in the basic practice of measurement: that is, selecting the right measures to track, and committing to effective reporting and tracking of those indicators. Yes it’s still true…What gets measured gets managed!

But some of us are still driving backwards…
I’ve worked for so long in the measurement arena, that it has almost become second nature to me, as it has for many companies who do it well. But every now and then, I’ll read a post or an article that reminds me of just how shallow some of the thinking still is in this arena, and the degree to which many businesses still underestimate or undervalue the importance of this basic tenet of Performance Management. So I thought I’d use a little space here to refresh us all on how important the “measurement part” really is, and offer some perspectives that can help lift our “collective game” a bit.
Let’s start by looking at why we measure things. There are a myriad of factors that drive us to select a performance metric and start tracking it.
Unfortunately, as an industry, we seem to have gotten stuck on just measuring results and outcomes. More than likely, that is because those are the things we see most often on our company’s Balanced Scorecard. So our first instinctive reaction at the business unit level is to simply expand on those by adding a few lower level supporting indicators, or finding better ways to visualize the reporting (via dimensional slicing and dicing of those results metrics over various time periods, geographic areas, product lines, etc.).
But only focusing on results and outcomes is what I call “managing in the rear-view mirror”.
Getting your eyes back on the road…
Granted, over the past few years, there’s been a lot more discussion around “leading and lagging” indicators, and some companies have gained decent ground in this area. But even that area has gotten blurred, and few companies have really been able to define the types of causality linkages that are required to extract any value from these distinctions.
Often, when I look at business unit performance reports, I see things that are “labled” leading indicators. But rather than being truly predictive in nature, they are simply portraying the result of some other process that comes before “theirs”. I would acknowledge that some lagging indicators can, in fact, be leading indicators for some other process, and vice versa, but the more time I spend studying the interplay between measures inside of the broader corporate environment, the more it looks like “spaghetti thrown against a wall”, than it does a deliberate effort to define and draw clear connections and dependencies in performance and define the real performance dynamics at play.
Take full advantage of your peripheral vision…
A few years ago, I defined a simple framework to help clients think through this at a fairly basic level. But instead of focusing on whether an indicator was “leading or lagging”, I focused on how the measure was going to be used, and what kind of performance dialogue would be initiated by tracking that metric.
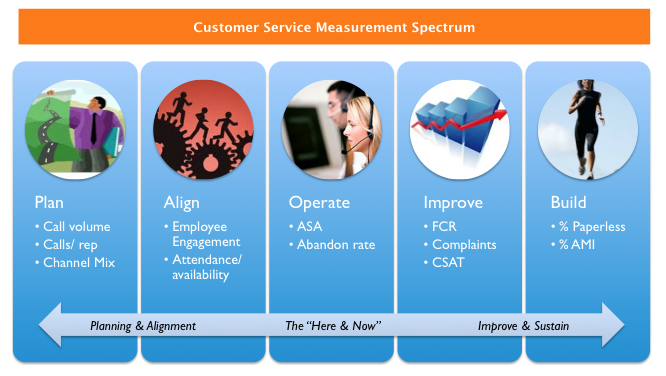
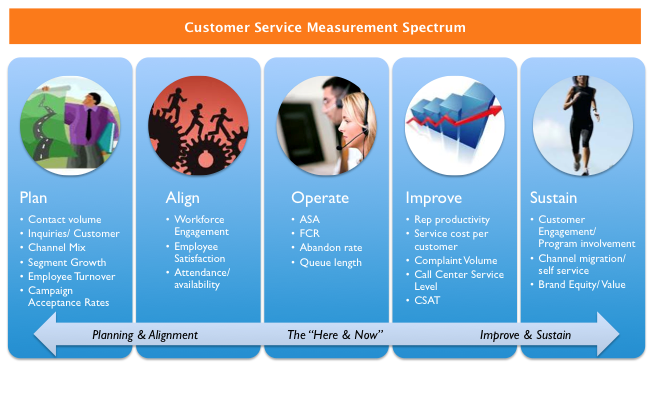
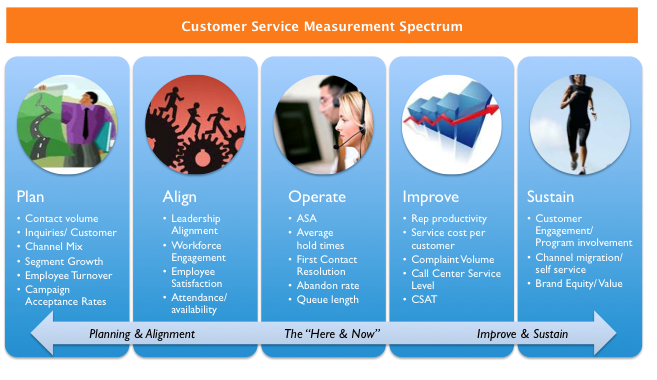
 The framework involves looking at your performance more holistically by focusing on five “uses” for a particular metric. I’ll use a Customer Service example, but these areas could be applied to any business unit, or the enterprise as a whole.
- Planning Metrics – These are the kind of metrics that help in your planning of workload and resources. There are two types of planning metrics: Those that help you see trends and variability by observing historical transaction volumes and variances; and those that are more predictive in nature (truly leading indicators) that help anticipate future trends (things like growth in particular segments, campaign “take rates”, trends in workforce demographics and attrition, etc.)
- Alignment Metrics– Those measures that will help you gauge the level of alignment and commitment of your team to your operating plans and strategies. While you might not measure all of these with high frequency, they are essential beacons to look at periodically (at minimum, quarterly or annually), with focus on both plan variance and external benchmarks. These may include things like employee satisfaction and alignment, as well as trends in attendance and employee availability.
- Operating Metrics– These metrics are analogous to what a pilot might use in the cockpit of an aircraft (e.g.- airspeed, altitude, etc.) Here, you are simply trying to keep these metrics within specified tolerances or control limits, so that any deviation in these can be quickly observed and corrected “on the spot.” Frequency is this area is often vital, with “real time” information being the desired level of reporting.
- Improvement Metrics-Those metrics that you will review (with perhaps less frequency (daily, weekly, monthly) to show both changes in operating performance trends, as well as the drivers of departmental results. You will use these to review, diagnose and problem solve. And they will become the basis for your ongoing continuous improvement projects. This area is usually where result or outcome measures show up, even though these metrics can also be used in planning stages. Things like Customer Satisfaction, Complaint Volume, First Contact Resolution, and Employee Productivity would fall into this category.
- Sustainability Metrics– While these measures may also be utilized in your planning phase, they mostly relate to those things that you are doing from a strategy perspective in shaping your long term vision for your department or organization. Driving major behavioral shifts in customer channel usage (paperless billing, mobile payments, online conversions, etc.) as well as overall customer engagement are the most common measures in this space.
There are clearly a lot of ways to look at your portfolio of measures to ensure you’ve got complete coverage. For example, some companies have success by categorizing their measures by reporting frequency, or the venue in which the metric will be discussed. But I find that understanding the stage in which the measure will be used, is equally important in ensuring you’ve got all bases covered.
While it may sound like I am contradicting the “balanced scorecard” principles to some degree by focusing on such a broad array of measures, I feel it is actually quite complementary to it. Not everything we look at is a KEY performance indicator (KPI) that would reside in your balanced scorecard. In fact, many of them won’t show up there initially. At the same time, however, I feel that some companies have gotten so “fixated” on the orthodox application of their Balanced Scorecard (in its most simplistic interpretation), that they have forgotten the many uses that metrics have in planning, managing, improving and sustaining performance.
Let’s plan a safer journey next time!
The good news is that most of you are already tracking, or are planning to track many of the metrics I mention above. At the same time, however, the manner in which these measures are tracked, reported, and utilized is most often viewed as “one size fits all”. That is, many of us will end up tracking these metrics with similar frequencies, reporting them to the same audience, discussing them in similar venues, and managing them in the same way we have always managed them.
As you move forward, I challenge you to think about your performance metrics, both holistically (do you have all bases covered?), and within their own discrete contexts for how they should be utilized and managed.
Oh, and one more thing…NO more reviewing your performance results on your iphone or ipad when you’re behind the wheel. That would likely negate any improvement gains we make in gaining back our peripheral vision (or as Stephen Wright the comedian like to call it, the “peripheral visionary”).
Author: Bob Champagne is Managing Partner of onVector Consulting Group, a privately held international management consulting organization specializing in the design and deployment of Performance Management tools, systems, and solutions. Bob has over 25 years of Performance Management experience and has consulted with hundreds of companies across numerous industries and geographies. Bob can be contacted at bob.champagne@onvectorconsulting.com

Pingback: An Interesting Week For Social Media Metrics… « Performance Perspectives
Thanks for the article Bob. We will be looking at improving our customer service metrics soon.
Lorne- Glad you enjoyed it! Look forward to catching up in the future. Be Well. -b